Drivers in Oregon and Washington spent much of September watching gas prices climb faster than almost anywhere else in the country. A sudden shutdown on the Olympic Pipeline, combined with refinery maintenance on the West Coast, squeezed gasoline supplies while daily commuting, school runs, and weekend trips kept demand steady. If you live in Portland, Seattle, Bend, or Eugene, the spike was not abstract — it showed up directly on every fill-up receipt.
What shut down and why prices jumped
The Olympic Pipeline is a roughly 400-mile line that carries refined gasoline and diesel from Washington refineries to distribution terminals in the Pacific Northwest, including Portland. According to reporting from OPB, the line went offline around September 2, 2025, in an unplanned outage. With pipeline flow interrupted, suppliers shifted some volume to barges — a slower and more expensive route.
Oregon has no in-state refineries. The Oregon Department of Energy notes that about 90% of the gasoline sold in Oregon is refined in Washington and moved south primarily by pipeline. When that artery stalls, the entire state feels it quickly. Washington drivers were not spared either: refinery maintenance in the region tightened supply on both sides of the Columbia River.
How high prices went — and how they compare nationally
AAA data tracked the surge in real time. For the week ending September 18, 2025, the national average for regular gasoline sat near $3.20 per gallon, up only about a penny from the prior week. Oregon's average jumped roughly 15 cents to about $4.29 per gallon, while Washington surged about 16.5 cents to $4.66 per gallon — briefly the highest statewide average in the nation, ahead of even California.
Oregon's average climbed from $3.98 on September 2 to a year-to-date peak near $4.30 on September 13–14. Washington moved from $4.39 to $4.66 over the same window. Meanwhile, drivers in the Gulf South still saw prices near $2.71 in Mississippi and $2.74 in Oklahoma, according to AAA's September 18 fuel report.
Monthly fuel math for typical Pacific Northwest vehicles
Spreads like that matter when you translate gallons into a monthly budget. Assume 1,000 miles of driving per month — a common figure for a mixed commute and errands.
Toyota RAV4 (28 mpg combined, 14.5-gallon tank): At the national average of $3.20/gal, 1,000 miles burns about 35.7 gallons, costing roughly $114 per month. At Oregon's $4.29/gal peak, the same mileage costs about $153 per month — roughly $39 more. In Washington at $4.66/gal, the bill reaches about $166 per month.
Ford F-150 (20 mpg combined, 26-gallon tank): One thousand miles consumes 50 gallons. Nationally that runs about $160 per month; at Oregon's peak, about $215; in Washington, about $233.
Honda CR-V Hybrid (40 mpg combined): The same 1,000 miles needs 25 gallons — about $80/month at the national average versus about $107/month at Oregon's peak. Hybrids do not eliminate regional price shocks, but they shrink the number of gallons exposed to them.
You can plug your own mpg, local price, and monthly mileage into the CarDiary MPG and fuel cost calculator to see how a 30-cent or 60-cent regional swing changes your household budget.
Relief is coming — but timing varies
By mid-September, reports indicated the Olympic Pipeline was resuming operations. AAA Oregon/Idaho noted that the restart, combined with the September 15 switch to cheaper winter-blend gasoline in Oregon, should push retail prices down over the following weeks. OPB energy analyst commentary suggested Oregon motorists could see declines of 35 to 65 cents per gallon over three to six weeks if no new refinery problems emerge.
California drivers face a separate watch item: fall refinery maintenance there could keep West Coast averages elevated even as the Pacific Northwest cools off. Gulf Coast and Plains states typically see less volatility because supply routes are more diversified and winter-blend production costs less.
Practical steps while prices stay uneven
Do not panic-fill unless you must. When a pipeline restarts and winter blend arrives, topping off at a peak can lock in the highest price of the cycle.
Compare stations within your route. AAA and GasBuddy-style apps show block-level variation. A five-cent difference on a 16-gallon fill saves 80 cents — small per stop, meaningful over a month.
Combine errands. Cold starts burn extra fuel. Clustering trips reduces gallons consumed regardless of pump price.
Check tire pressure monthly. Underinflated tires lower mpg by 1–3% according to the EPA, which quietly raises your effective cost per gallon.
Track every fill-up. When a supply shock hits, a handwritten log or scattered receipts make it hard to tell whether your monthly fuel spend actually changed or you just drove more.
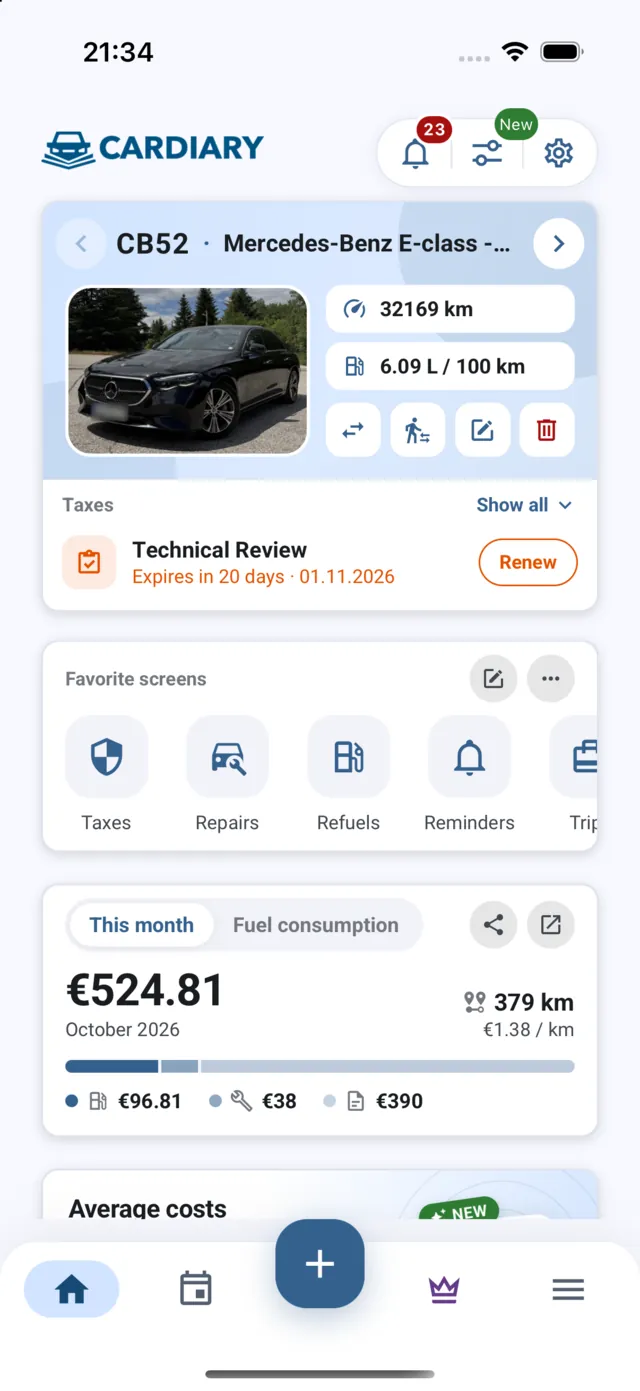
Logging each fill with the price per gallon and odometer reading in CarDiary gives you a running monthly fuel total without rebuilding a spreadsheet every time Oregon or Washington swings above the national average.
Why this keeps happening in the Northwest
Geography explains the pattern. Washington's five refineries cluster near Puget Sound ports; Oregon depends on that output moving through a single major pipeline corridor. Planned refinery turnarounds in fall — when plants switch from summer-blend to winter-blend production — routinely tighten supply. An unplanned pipeline outage on top of that maintenance window creates the kind of double-digit cent jump Pacific Northwest drivers saw in September 2025.
National averages can look calm while your local market surges. That is normal during regional supply disruptions, and it is exactly why tracking your own gallons and costs matters more than watching a single headline number.